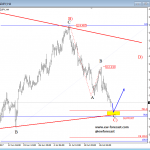
USDJPY Completing A Pullback and Turning Higher – Elliott wave

USDJPY made a sharp rise from the 101.16 level, following a completed A-B-C move into a leg Y of C), which is part of a bigger triangle correction. We labelled recent rally as A of D), which is completed at 111.74 level, and is being retraced for almost 61.8 percent into a corrective wave B.
USDJPY, daily

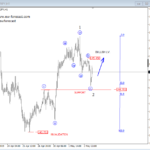
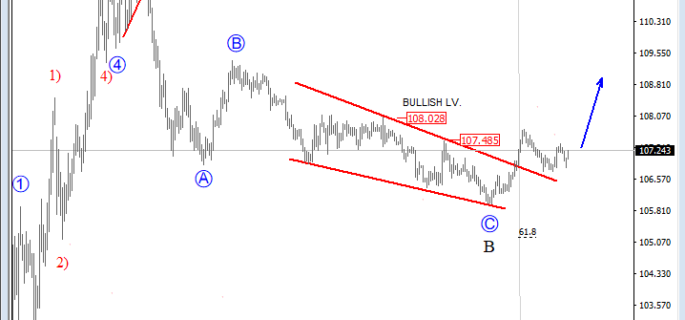
On 4h chart of USDJPY we see price completing higher degree wave B, slightly above 105.8 level, with an Elliott wave ending diagonal in C. Latest rally which breached the upper Elliott wave ending diagonal line, and is now trying to break above 108.03 level is evidence that the trend is turning bullish. However, we still want to see price rally above 108.03 level for confirmation that bulls took over.
USDJPY, 4h

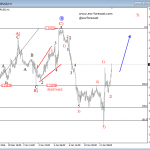
An Elliott wave leading diagonal is a powerful reversal pattern, which tends to push price sharply into the opposite direction, and usually to the starting point of the pattern. In our case this is at 109.38 level.
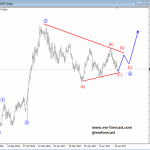
An example of an Elliott wave ending diagonal:
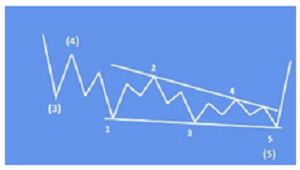
- structure is 3-3-3-3-3
- a wedge shape within two converging lines
- wave 4 must trade into a territory of a wave 1
- appears primarily in the fifth wave position, in the C wave position of A-B-C and in double or triple threes as the final “C” wave
Disclosure: Please be informed that information we provide is NOT trading recommendation or investment advice. All of our work is for educational purposes only.
http://www.ew-forecast.com/service
Find more: Contributing Author