Elliott Wave Analysis: USDJPY Daily and Intraday Forecast

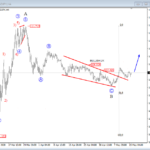
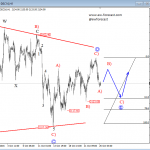
On the daily chart of USDJPY, we can see bigger sideways price action unfolding, which can be a triangle correction in the making. An Elliott wave triangle correction is a continuation pattern, which means after it unfolds a new push in the direction of the trend may follow (in our case this is to the upside). Triangles can occur in wave 4, wave B, wave X position or in some very rare cases also in wave Y of a combination; they are overlapping five wave affairs that subdivide 3-3-3-3-3.
All being said, we now see sub-wave C) of a triangle in wave 4 being made, that can in days ahead search for support around the lower triangle line.
USDJPY, Daily

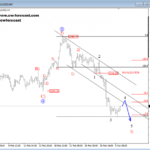
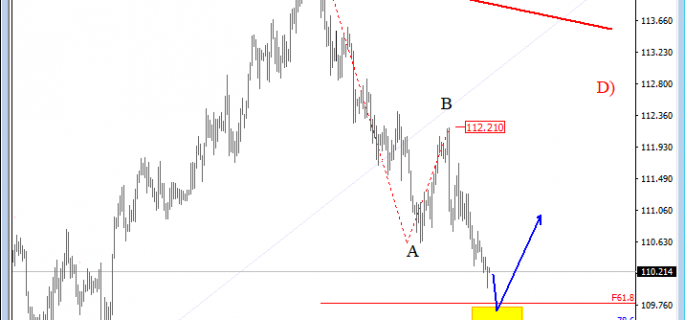
On the 4h chart we are observing the higher degree leg C) and its three-wave structure. In a triangle pattern, each leg has its own three legs, which are corrective in nature. Current price action suggests sub-wave C of C) unfolding, that can search for support near the Fibonacci ratios of 61.8/78.6. Once red wave C) unfolds, a new three wave correction can be expected to follow into the following wave D) of a triangle pattern.
USDJPY, 4H

Disclosure: Please be informed that information we provide is NOT trading recommendation or investment advice. All of our work is for educational purposes only.
http://www.ew-forecast.com/service
Find more: Contributing Authors