Gold – Drops Sharply to Support at $1275
Gold for Friday, August 22, 2014
Over the last few days Gold has been easing lower back towards the medium term support level at $1290 however in the last 24 hours it has fallen sharply back to the previous key level at $1275 which has held it up for a little while. A couple of weeks ago Gold had been meeting resistance around $1313 which has seen it finally ease lower to end last week and at the start of this week. Just prior to that it moved well away from the support level at $1290 and back up well above $1300 to a two week high above $1322 before easing lower. It had also been easing lower and placing pressure on the support level at $1300 which eventually gave way resulting in gold falling sharply back down to a six week low near $1280 a few weeks ago. Over the last few weeks the $1290 level has shown some signs of support and held gold up and this level has been called upon again in the last week to prop gold up. During the second half of June, gold steadily moved higher but showed numerous incidents of indecision with its multiple doji candlestick patterns on the daily chart. This happened around $1320 and $1330.
The OANDA long position ratio has moved back up strongly to above 70% again as gold has fallen sharply back down towards $1275. At the beginning of June, gold did very well to repair some damage and return to the key $1275 level, then it has continued the momentum pushing a higher to its recent four month high. After moving so little for an extended period, gold dropped sharply back in May from above the well established support level at $1275 as it completely shattered this level falling to a four month low around $1240. It remained around support at $1240 for several days before its strong rally higher. It pushed down towards $1280 before sling shotting back and also had an excursion above $1300 for a short period before moving quickly back to the $1293 area again. Over the last few weeks gold has eased back from around $1315 to establish its recent narrow trading range below $1295 before its recent slump.
Way back since March, the $1275 level has established itself as a level of support and on several occasions has propped up the price of gold after reasonable falls. Throughout the second half of March gold fell heavily from resistance around $1400 back down to a several week low near support at $1275. Both these levels remain relevant as $1275 continues to offer support and the $1400 level is likely to play a role again should gold move up higher. Through the first couple of months of this year, gold moved very well from a longer term support level around $1200 up towards a six month higher near $1400 before returning to its present trading levels closer to $1300.
Gold settled at its lowest level since late June on Thursday, extending losses to a fifth session, as fears about an early interest rate hike by the U.S. Federal Reserve sparked a technical sell-off after prices broke below a key support level. Bullion was hit hard by follow-through selling after minutes from the Fed’s July meeting showed on Wednesday policymakers debated whether interest rates should be raised earlier given a surprisingly strong job market recovery, traders said. Economic optimism also pressured gold on encouraging U.S. housing and jobs data on Thursday, when bullion underperformed the precious metals complex and equities, with the S&P 500 index up 0.4 percent to a new intraday record. In overnight trading between 2:00 a.m. and 2:05 a.m. ET, more than 8,000 lots changed hands for the December contract, or about one-third of the volume at the time, when prices broke below $1,287 an ounce, the 200-day moving average where traders placed stop-loss orders, traders said.
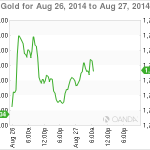
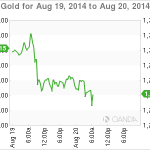
(Daily chart / 4 hourly chart below)


Gold August 21 at 23:55 GMT 1277.2 H: 1278.4 L: 1276.8
Gold Technical
![]()
During the early hours of the Asian trading session on Friday, Gold is trading in a narrow trading range right above $1275 after its recent sharp fall which saw it move strongly from above $1290. Current range: trading right around $1277.
Further levels in both directions:
• Below: 1275 and 1240.
• Above: 1330.
Economic Releases
- 12:30 CA CPI (Jul)
- 12:30 CA Retail Sales (Jun)
*All release times are GMT
This article is for general information purposes only. It is not investment advice or a solution to buy or sell securities.
Source: marketpulse