Elliott Wave Analysis On S&P500 And Crude OIL
 S&P500
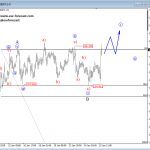
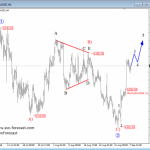
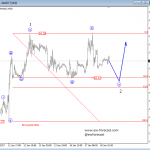
E-mini S&P500 is clearly bullish on a daily chart so we will look for more gains after any pullback on lower time frames. Well, in the mid-term traders should be aware of a corrective retracement back to around 2010 level as we see current leg up as wave 5 of an extended red wave 3) which can slow down at 2080 where we see 200% Fibonacci extension level and also upper line of a trading channel that can turn into a resistance.
S&P500, 4H

Click to Enlarge
Crude OIL
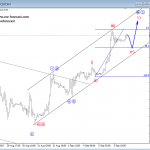
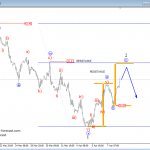
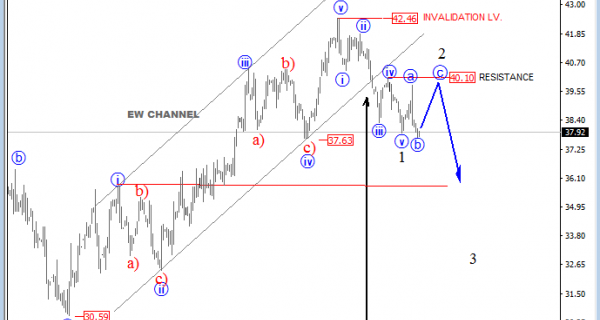
Crude oil is turning down from 42.46 through the channel support line connected since February. This is one of the most important evidences for a trend change. Not only that, notice that decline from the highs is also in five waves which is strong evidence for coming bearish waves. As such, traders should be aware of more weakness in sessions ahead, but after wave 2 bounce that can lift price back to 40.00 resistance from where we will expect a new strong decline. Based on Elliot wave count and minimum expectations we assume that oil can decline back to 35.00 area.
Crude OIL, 4H

Click to Enlarge
http://www.ew-forecast.com/service
Find more: Contributing Authors