


USD Index: Bulls Could Be On The Move, 94.00 Could Follow
 On USD index daily chart we are observing a big sideways, slow and overlapping price action which is a personality of a contra-trend movement. We are observing a flat pattern in black wave IV. It’s a three wave pattern where final subwave, wave C should be made by five waves. Well, we can see nice decline from end of 2015 that can be in five legs, but as an ending diagonal. That’s a reversal pattern which may send price into a strong bullish mode in the second part of this year, after price recovers back above 95.22.
USD Index, Daily

Click to Enlarge
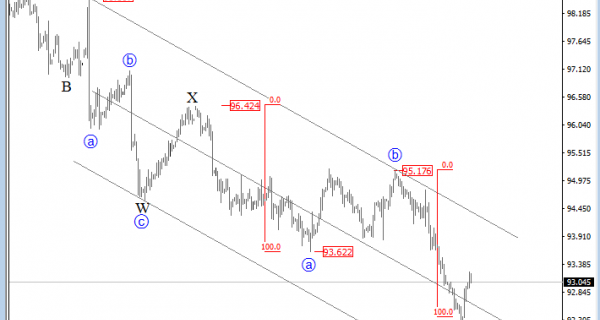
On the lower time frame, USD index dropped sharply recently following a completed three waves of recovery from 93.62 to 95.17. An updated count shows it was wave b-circled as part of a complex correction so with recent leg down we think that double zigzag can be coming to an end. Notice that price traded down to our Fibonacci levels from where we have seen a perfect reaction to the upside. It looks like a small impulse that will take price even higher in sessions and days ahead.
USD Index, 4H

Click to Enlarge
http://www.ew-forecast.com/service
Related Posts
 Elliott Wave Analysis: USD Index Trading Within A New Uptrend
 Bearish Triangle On USD Index Can Support GBPUSD – Elliott wave analysis
 Elliott Wave Analysis on USD Index Trading In A Probable Bullish Sequnce
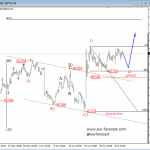 Elliott Wave Analysis: USD Index Aiming For 98 Zone
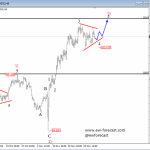 Elliott Wave Analysis: USD Index Impulsively Getting Stronger And Reaching New Highs


