


S&P500 Above the 3000 Mark – Elliott Wave Analysis

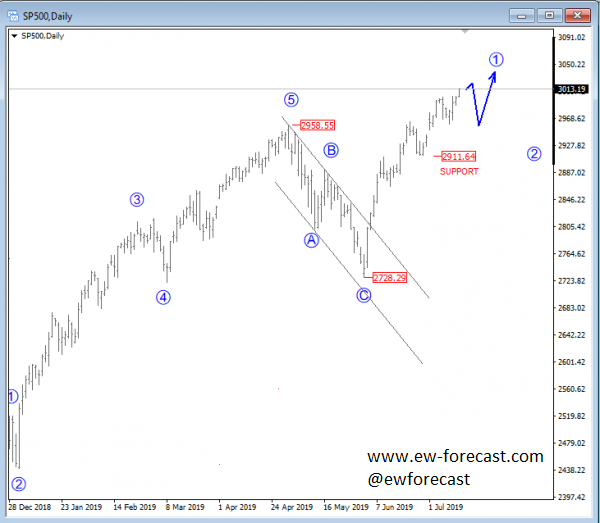
S&P500 made clear five waves from the 2321 level, where a bigger corrective wave IV) as part of a bigger cycle had ended. These five waves were later followed by a temporary, three-wave pullback which found support near the 2728 area, from where a new strong rally started to take place. We know that after a three-wave pullback fully develops, that is when the trend may continue its path, in our case to the upside. Also, a break above the upper channel line can be another evidence of a change in trend.
We are observing a wave 1 of a bigger cycle unfolding, so be aware of a temporary pullback, once it finds resistance.
S&P500, Daily
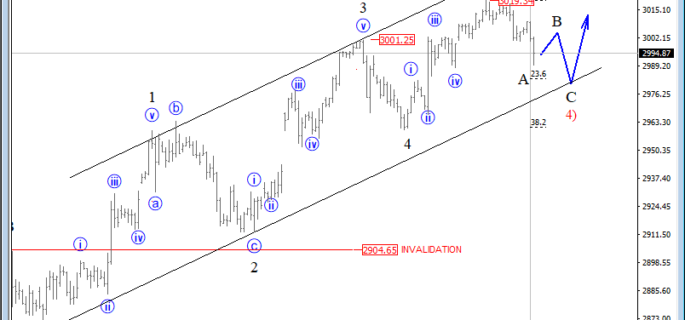
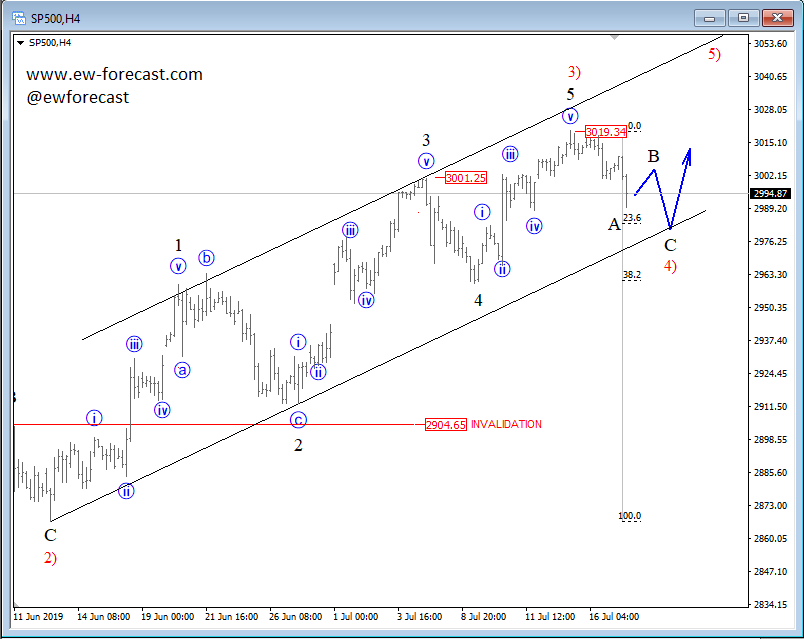
On the 4h chart of the stock market, we are tracking a bigger impulse (wave 1) in the making, with a recently completed wave 3) at the 3019 area. If that is the case, then current intra-day drop can be part of a three-wave A-B-C pullback within a wave 4), with possible support near the Fibonacci ratio of 23.6/38.2 (2986/2960 region).
S&P500, 4h
Disclosure: Please be informed that information we provide is NOT trading recommendation or investment advice. All of our work is for educational purposes only.
http://www.ew-forecast.com/service
Find more: Contributing Authors
Related Posts
 S&P500 Already in A Bearish Reversal – Elliott wave analysis
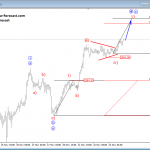 Elliott wave analysis: AUDUSD and S&P500
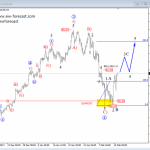 Elliott wave Analysis: S&P500 and Crude OIL Update
 Elliott Wave Analysis: S&P500 Targeting 3000, while USD Index Breaking Down!
 Bulls Pushing AUDUSD Into a Bullish Cycle, while S&P500 Trading in A Correction – Elliott wave Analysis


