


Price Trapped In A Complex Correction On USDJPY; More Weakness Could Be Around The Corner

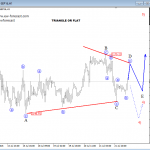
On the daily chart of USDJPY we are observing a nice impulsive decline taking place, with price now trading in one of its temporary corrective sub-waves, wave 4-circled. If that is the case, then current sideways price action could suggest that we are dealing with a triangle correction, a continuation pattern that can push price towards the 96.00 area, once the pattern is completed.
USDJPY, Daily

Click to Enlarge
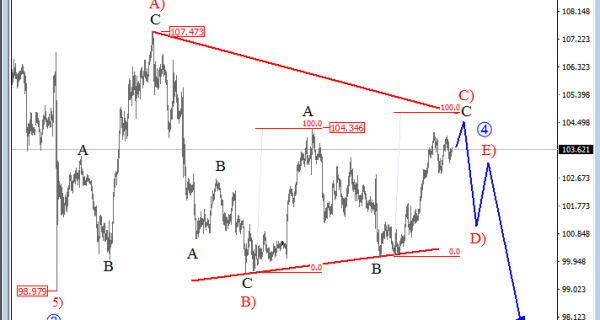
Regarding the lower time frame, we can see that USDJPY is trading higher for the last two weeks towards 104.34 swing so it appears that wave four correction since June is going to be more complex and longer in time. An updated wave count shows wave C) up from August that can still be part of a triangle formation which means that price can turn lower later this month for wave D), towards the lower side of a triangle range as shown on the 4h chart. If we are correct, then resistance can be found at 104.50/105.00 area.
USDJPY, 4H

Click to Enlarge
A Triangle is a common 5 wave pattern labeled A-B-C-D-E that moves counter-trend and is corrective in nature. Triangles move within two channel lines drawn from waves A to C, and from waves B to D. A Triangle is either contracting or expanding depending on whether the channel lines are converging or expanding. Triangles are overlapping five wave affairs that subdivide into 3-3-3-3-3.
Basic Triangle Pattern:

http://www.ew-forecast.com/service
Find more: Contributing Authors
Related Posts
 Elliott Wave Analysis On USDJPY And S&P500
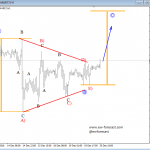 Elliott Wave Analysis: USD Index, USDJPY and S&P500
 Elliott Wave Analysis: USDJPY In Final Stages Of A Complex Correction; Possible Turning Point Around 105
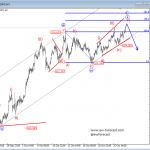 Elliott Wave Analysis On USDCHF And USDJPY
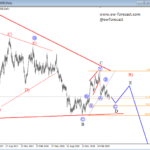 Elliott wave Analysis: Silver Can Be At The End Of A Big Triangle Pattern


