Elliott Wave Analysis: Triangle On The S&P500 Point Towards Higher Levels
 Elliott Wave Analysis: Triangle On The S&P500 Point Towards Higher Levels
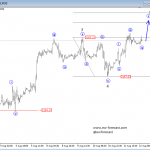
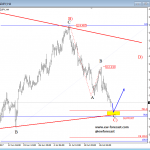
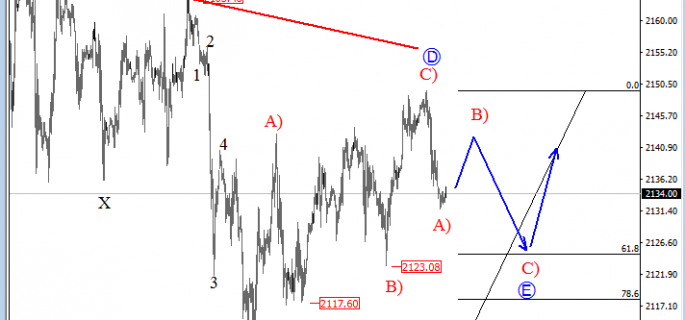
The S&P500 is trading sideways for quite some time now, with overlapping price movements that suggests this stock being trapped in a probable Elliott wave triangle correction. An Elliott wave triangle correction is a complex pattern, consisted out of five sub-waves A-B-C-D and E with each leg having three more sub-waves. At the moment we see price trading in the final wave E, with a probable reversal zone higher around the 61.8 or 78.6 Fibonacci ratio.
That said we also know that triangles are continuation patterns, meaning they can cause nice and sharp reversals, after the pattern is completed.
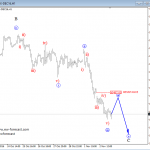
S&P500, 1H

Click to Enlarge
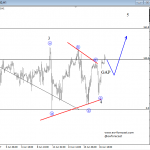
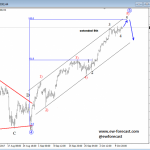
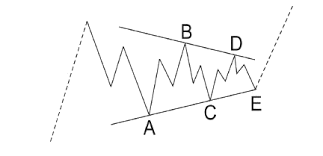
Triangles are overlapping five wave affairs that subdivide 3-3-3-3-3. They appear to reflect a balance of forces, causing a sideways movement that is usually associated with decreasing volume and volatility.
Basic Triangle Pattern:
http://www.ew-forecast.com/service
@ewforecast
Find more: Contributing Authors