Elliott Wave Analysis: USD Index and S&P500

Elliott Wave Analysis: USD Index and S&P500
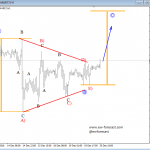
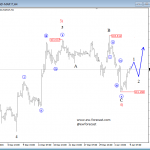
USD Index is sharply and strongly turning lower, away from Fibonacci ratio of 161.8 and former swing high at 94.13 level, which gives us an idea of a minimum three-wave bearish reversal to be in progress, but ideally decline will be in five waves within a higher degree wave 5). We also see price approaching levels near the 92.70 zone where overlap with wave A will be just another confirmation for weaker prices ahead while market trades below 94.30.
USD Index, 4H

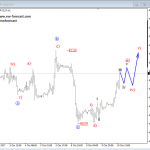
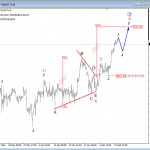
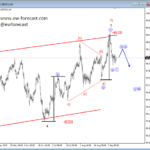
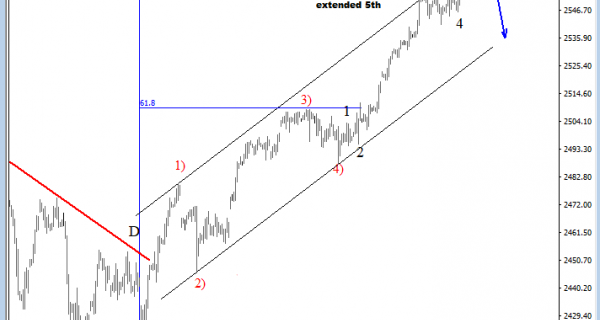
On the S&P500 we are now looking at a five-wave bullish impulse in the making within blue wave 5 as part of a higher degree wave III. We can see that price is trading quite nicely to the upside, displaying characteristics of an extended fifth wave, which means that price can see even more upside in days ahead. We see index going for 2560/70 while price trades above 2540 level based on latest developments. A later minor five-wave turn below the bullish channel line would indicate a completed impulse and a change in trend to be in progress.
S&p500, 4h

Disclosure: Please be informed that information we provide is NOT trading recommendation or investment advice. All of our work is for educational purposes only.
http://www.ew-forecast.com/service
Find more: Contributing Authors