


International trade in services: EU surplus up to over €190 bn
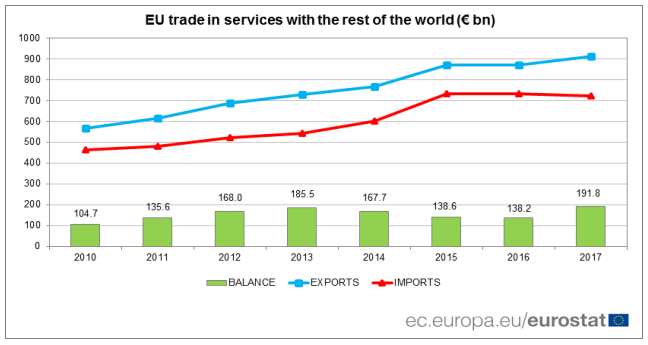
The European Union (EU) surplus in trade in services, which had fallen between 2013 and 2016, increased to €191.8 bn in 2017. This is the result of EU exports of services to the rest of the world rising by 5%, from €870.5 bn in 2016 to €912.4 bn in 2017, while EU imports decreased by 2%, from €732.3 bn to €720.7 bn.
EU has largest surplus with EFTA countries
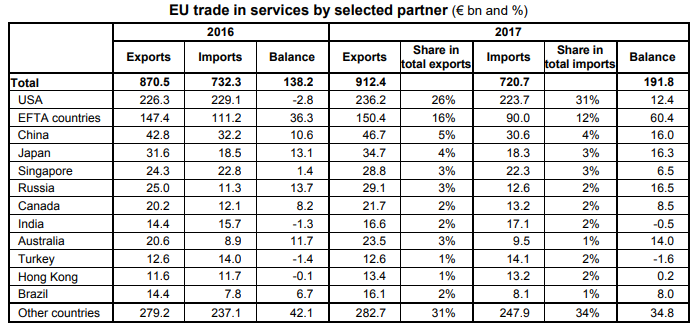
In 2017, the main partners for EU exports of services remained the United States (€236.2 billion, or 26% of total EU exports) and the four EFTA countries together (€150.4 bn, 16%), well ahead of China (€46.7 bn, 5%) and Japan (€34.7 bn, 4%). The main partner for EU imports of services also continued to be the United States (€223.7bn, 31% of total EU imports), followed by the EFTA countries (€90.0 bn, 12%), ahead of China (€30.6 bn, 4%),Singapore (€22.3 bn, 3%) and Japan (€18.3 bn, 3%). The EU recorded surpluses with almost all its main partners in 2017, except Turkey (-€1.6 bn) and India (-€0.5 bn). Among the main partners, the largest surplus was observed in trade with the EFTA countries (+€60.4 bn), ahead of Russia (+€16.5 bn), Japan (+€16.3 bn) and China (+€16.0 bn).
Compared with 2016, the EU deficit turned into a surplus with the United States (from -€2.8 bn in 2016 to +€12.4 bn in 2017) and Hong Kong (from -€0.1 bn in 2016 to +€0.2 bn in 2017), while a significant increase in the EU surplus can be noted with the EFTA countries (from +€36.3 bn in 2016 to +€60.4 bn in 2017). In contrast, the EU surplus fell with other countries (from +€42.1 bn in 2016 to +€34.8 bn in 2017).
The source dataset can be found here.
EU surplus largely sustained by ICT services
The main components of EU exports of services were “other business services” (R&D, business, professional & technical services) which accounted for over a quarter of EU total exports (26%) in 2017, followed by transport (18%) and travel (15%), ICT services (14%), financial services (9%) and charges for the use of intellectual property (8%). “Other business services” were also the largest category of services imported by the EU (30% of EU imports), ahead of transport (18%), charges for the use of intellectual property (16%) and travel (15%).
In 2017, ICT services remained the largest contributor to the EU surplus (+€74.1 bn), ahead of transport (+€39.1 bn), financial services (+€38.2 bn) and travel (+€30.6 bn). In contrast, a deficit was recorded for charges for the use of intellectual property (-€37.5 bn).

The source dataset can be found here.
These data, issued by Eurostat, the statistical office of the European Union, are subject to revision.
Geographical information
The European Union (EU) includes Belgium, Bulgaria, Czechia, Denmark, Germany, Estonia, Ireland, Greece, Spain, France,m Croatia, Italy, Cyprus, Latvia, Lithuania, Luxembourg, Hungary, Malta, the Netherlands, Austria, Poland, Portugal, Romania, Slovenia, Slovakia, Finland, Sweden and the United Kingdom. EFTA (European Free Trade Association) includes Iceland, Liechtenstein, Norway and Switzerland. The full geographical breakdown of the services account is available on the Eurostat website. All figures can be downloaded from the balance of payments section.
Methods and definitions
The main methodological references used for the production of statistics on international trade in services are the International Monetary Fund (IMF)’s sixth balance of payments manual (BPM6) and the United Nations’ manual on statistics of international trade in services.
International trade in services is geographically allocated according to the residence of the trading partner.
Revisions and time table
The annual statistics on EU international trade in services are collected under the BPM6 methodology. Figures are provided bym the Member States to Eurostat nine months after the reference period. The annual data covered in this News Release will be revised in one year’s time when revised data will be transmitted by Member States. The figures shown in the tables may not exactly add up due to rounding.
Source: Eurostat
Related Posts
 Visualizing the world’s largest importers in 2017
 The EU, USA and China account for almost half of world trade in goods
 First residence permits issued in the EU Member States remain above 3 million in 2017
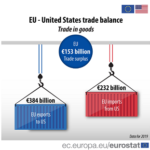 EU-US trade in goods: €153 billion surplus in 2019
 The Top Exporters and Importers of eggs in the European Union


