GBPUSD Looking Bearish in 2020 (video) – Elliott wave

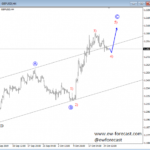
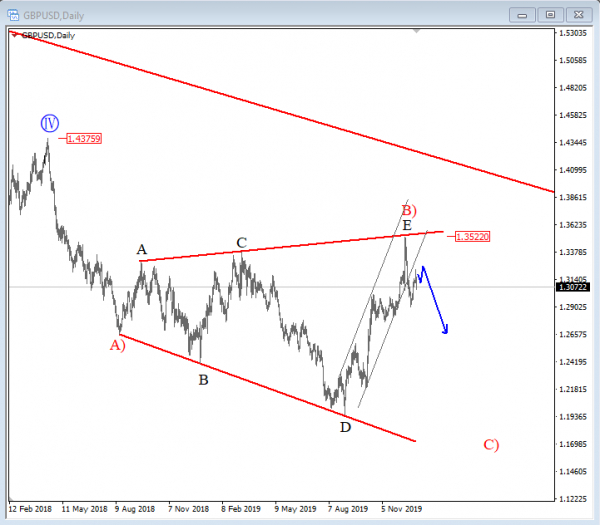
GBPUSD pair can be ending a triangle correction within the wave B). Potential resistance/turning point area for leg E can be at the upper side of the upper triangle line at 1.34/1.36 zone, from where we can already see price sharply dropping. A sharp and decisive drop below the lower channel line, connected from the low of wave D would suggest a completed triangle, and further weakness.
GBPUSD, Daily
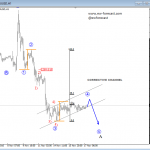
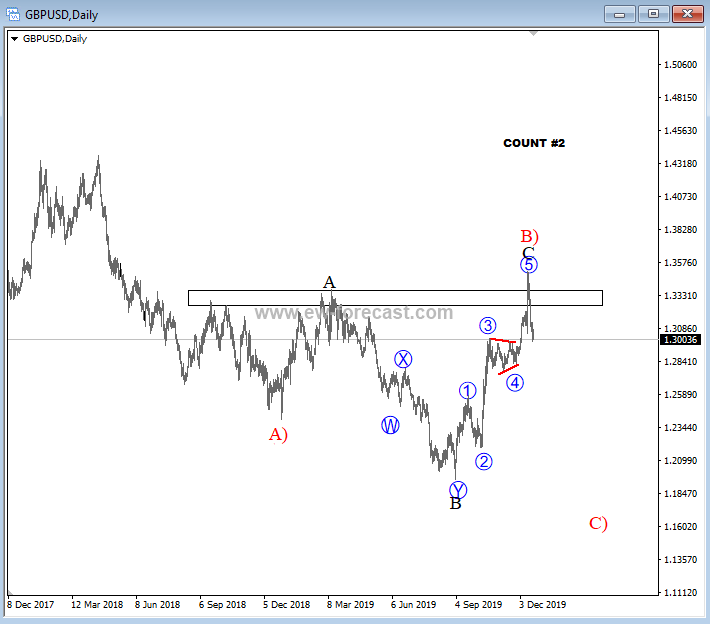
On count #2 we labelled a flat correction. Both counts are bearish, so we are expecting a bearish turn in either case.
GBPUSD, Daily #2
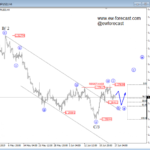
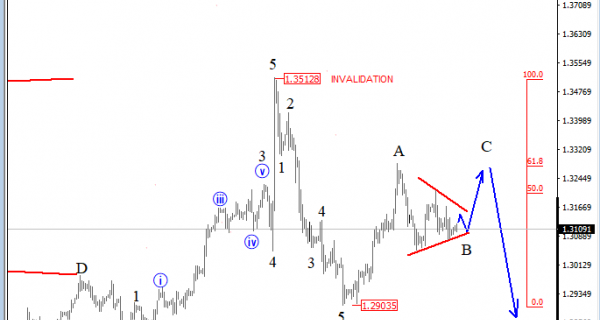
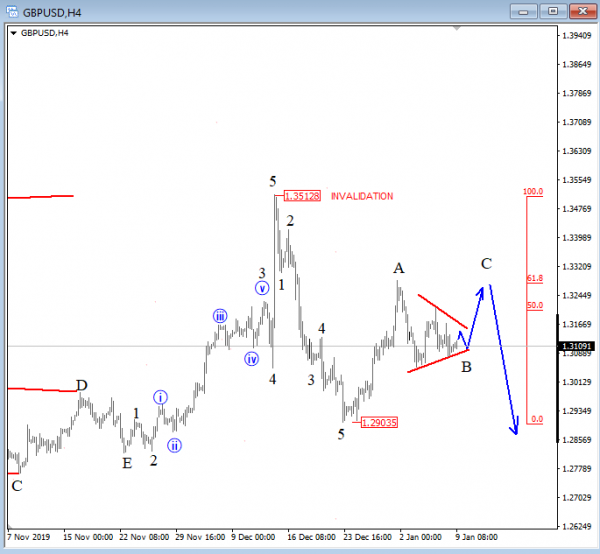
Now, looking at the 4h chart we can see that price fully unfolded a five-wave move to the downside and found support at the 1.290 level, from where an A-B-C move higher started developing. This three-wave move higher can be only a correction within the downtrend and can stop for a bearish turn near the Fib. ratio of 50.0/61.8 (1.325/1.331 region).
GBPUSD, 4h
Also, if you have not seen our outlook for the year 2020, please take your time and watch the video below:
Disclosure: Please be informed that information we provide is NOT trading recommendation or investment advice. All of our work is for educational purposes only.
http://www.ew-forecast.com/service
Find more: Contributing Author