GBPAUD Showing Evidence of a Bearish Resumption – Elliott wave analysis

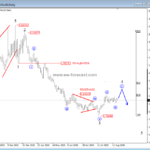
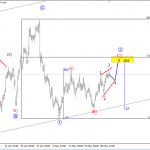
On the weekly chart of GBPAUD we see price sharply declining, down from 2.08 high, after a sideways, choppy movement from October lows of 2016. Also, price is breaking below the lower corrective channel line which is evidence that further weakness may be seen.
GBPAUD, weekly

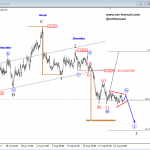
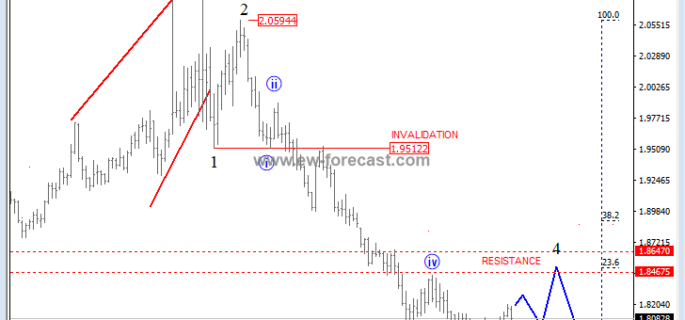
Daily chart is showing a clear bearish structure, a five-wave impulse in play, where wave 4 correction is currently unfolding. A wave 4 correction can see resistance and a bearish resumption at the 1.846/1.864 level, where former corrective wave iv can react as resistance. Also, the Fib. Ratio of 23.6 and 38.6 can slow temporary bulls down.
GBPAUD, daily

Disclosure: Please be informed that information we provide is NOT trading recommendation or investment advice. All of our work is for educational purposes only.
http://www.ew-forecast.com/service
Find more: Contributing Author