Is The 9-Year Drought For Value Investing History?
 The notion that value outperforms in the long run is a staple in the financial literature, and for an obvious reason: the historical record tells us so. But the last nine years tell a different story, based on the return spread for the Russell 1000 Value Index less the Russell 1000 Growth Index. As AJO Partners in Philadelphia advised in an investment note last week, the current run of growth’s outperformance in the US large-cap space is the longest period of superior results over value since the history of the Russell indexes, which dates to the 1970s.
Growth’s enduring outperformance isn’t a total surprise, according to AJO. In the previous run of value’s sub-par run, growth dominated for roughly seven years, courtesy of a tech bubble that rendered value investing null and void for an extended stretch.
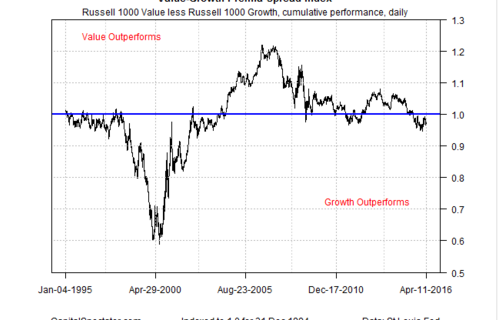
The current slide for value can be seen in the chart below, which reflects an index of the cumulative results of the daily return spread for the Russell 1000 Value Index less the Russell Growth Index. When the line is falling, growth is outperforming; when the line rises, the value trend is hot.
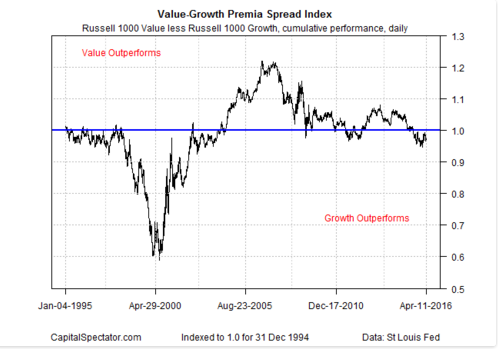
This benchmark peaked at around 1.22 in mid-2006, when the rear-view mirror for value looked impressive. Since then, growth has dominated value, albeit in fits and starts. The decline and fall of value over the past nine years has been a comparatively quiet affair, punctuated with temporary value rallies. But the persistent dominance of growth through time has been conspicuous for much of the past decade.
The question is whether value is finally poised for a enduring rebound? Some analysts see clues that the tide is turning, in part because of value’s relative strength over growth so far this year. But there have been several false dawns for value over the last nine years and no one knows if this time is different.
Meantime, AJO’s Jocelin Reed points out an intriguing development in value’s underperformance vs. growth in recent years—the rise of the sector factor:
A peculiar thing has occurred in the value/growth returns: sector allocation drove the underperformance of value compared to growth. In the most recent run, on an annualized basis, the growth index outperformed the value index by 4%. Interestingly, nearly 75% of this return differential is a result of growth sectors outperforming value sectors. Growth typically dominates when information technology outperforms financials and consumer stocks outperform energy. As such, the global financial crisis (GFC) and oil shocks define this period far more than a breakdown in the fundamentals of value investing. Whew!
Prior to this period, the sector allocation between the style benchmarks went the other way, adding to the returns of the value index. Regardless of direction, the influence of sectors had previously accounted for about 10% of the difference in returns—not the 75% we note above.
Exactly what the sector twist means for analyzing the prospects for value vs. growth is debatable. Reed notes that while style performance of late is “defined by sector performance… the fundamental quest to find stocks with the most attractive valuations relative to peers is still our most effective tool,” she writes.
The only question is whether the headwinds for this strategy will find some top-down relief on an extended basis going forward via the indexes?
By James Picerno, http://www.capitalspectator.com/
Find more: Contributing Authors