10 ‘poorest’ companies make investors rich
Investors love to think companies with piles of cash must surely make them rich, too. But this year, it’s the companies with the least moolah that are making the most cash for investors.
The 10 companies in the Standard & Poor’s 500 with the least amount of cash, cash equivalents and investments, including energy firm Range Resources (RRC), Martin Marietta (MLM) and telecom Windstream Holdings (WIN), have outperformed both the market and the companies with the deepest pockets, according to a USA TODAY review of data from S&P Capital IQ. The analysis excluded financial firms. And the analysis is based on the balance sheet classifications of cash and investments.
Shares of these “cash poor” companies, on average, are up 12.8% on average this year. That beats the nearly 8% gain by the Standard & Poor’s 500 this year. And it’s double the the 5.6% average gain of the stocks with the most money and investments, including Apple (AAPL), General Electric (GE) and Exxon Mobil (XOM).
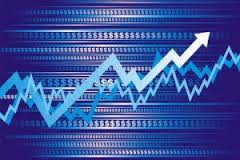
Below is a chart that plots a custom equal-weighted index of the “cash poor” companies versus the “cash rich” ones and the S&P 500:

The big winner among the companies with (much) less money than Apple is Newfield Exploration, an energy firm that reported cash and investments of just $62 million. Shares of the company are up 60% this year thanks to investors expectation of better earnings growth ahead. Analysts are forecasting adjusted earnings in 2014 to be up 29% this year.
Another big winner with not much cash in the bank is Martin Marietta Materials. The stock is up 31%, even though the company reported cash and investments of just $34 million. Again, it’s another story of investors seeing strong growth ahead. Analysts are calling for the company to post 43% higher adjusted earnings this year.
That’s not to say there aren’t any “rich” companies’ stocks doing well. Apple has $165 billion in cash and investments, more than any other company in the study. And the stock is up a respectable 22% this year. But on the other hand, there’s General Electric, which reported a big pile of nearly $70 billion. The stock, though, is down 7.6% this year.
And to be sure, there are some accounting and market nuances to be aware of in any analysis like this. And these “cash poor” companies likely have more cash than that’s indicated in the strict balance sheet classifications. Energy firm, Range Resources, for instance didn’t provide a cash line item, however it did report current assets of $203 million, some of which might be cash. Additionally, many of these companies are energy companies which may not have much cash on hand, but are generating cash flow and have much of their capital invested in long-term equipment. Short-term investments were included in the analysis since these assets can be turned into cash in less than a year. Long-term investments were included since many companies invest excess cash in order to get a return, but these investments can be liquid if needed.
But one thing’s for sure. None of these companies have anywhere near the financial resources of the Apple’s of the world. So, chalk one up for the companies of more modest means — at least this year.
Below are the 10 companies in the S&P 500 that have the least amount of cash, cash equivalents, short-term investments and long-term investments:
*
| Company | Symbol | Cash & investments ($ mils) | YTD % Ch. |
| Range Resources | RRC | $0 | -11% |
| Denbury Resources | DNR | $12 | -1.4% |
| Southwestern Energy | SWN | $23 | -0.7% |
| Stericycle | SRCL | $26 | 1.1% |
| Martin Marietta | MLM | $34 | 31% |
| Ameren | AEE | $46 | 7.4% |
| Republic Services | RSG | $50 | 18.1% |
| Windstream Holdings | WIN | $55 | 41.5% |
| Tractor Supply | TSCO | $56 | -18.1% |
| Newfield Exploration | NFX | $62 | 60.3% |
Sources: S&P Capital IQ, USA TODAY
* The company did report $203 million in current assets, which might include cash
And in case you’re curious, there are the 10 S&P 500 companies with the largest amounts of cash, cash equivalents, short-term investments and long-term investments:
| Company | Symbol | Cash & investments ($ mils) | YTD % Ch. |
| Apple | AAPL | $164,611 | 22.3% |
| Microsoft | MSFT | $99,538 | -25% |
| General Electric | GE | $69,989 | -7.6% |
| GOOGL | $60,730 | 5.6% | |
| Cisco Systems | CSCO | $60,730 | 10.8% |
| Pfizer | PFE | $51,777 | -4.6% |
| Exxon Mobil | XOM | $41,193 | -3.8% |
| Chevron | CVX | $40.158 | 0.2% |
| Oracle | ORCL | $38,842 | 6.4% |
| Coca-Cola | KO | $37.377 | 1.5% |
Source: Usatoday