Asia Pacific Anti-Corruption Rankings for 2014
Transparency International recently released its always keenly awaited annual Corruption Perceptions Index (CPI) for 2014, just after a new bribery risk index was launched by TRACE International. The CPI has been an authoritative and valuable tool for measuring perceived levels of public sector corruption around the world since 1995. However, in November of this year, the TRACE Matrix was introduced, the first bribery risk index specifically tailored to the needs of the business community.
The Corruption Perceptions Index
Transparency International (TI), a global non-government organization, gathers information through reviews of 13 different data sources to provide an annual index that ranks and scores countries based on the perceived level of public sector corruption. Its composite index presents an overall score for each of the 175 countries included in the 2014 version. The TI scoring methodology runs from 0 (most corrupt) to 100 (least corrupt), which is the basis for the TI ranking, with the #1-ranked country being the least corrupt (Denmark, with a score of 92) and No.175 as the most corrupt (North Korea and Somalia, both with scores of 8).
The TRACE Matrix
TRACE International (the not-for-profit affiliate of TRACE Inc.), in collaboration with RAND Corporation, a not-for-profit public policy research organization, has provided an additional tool, the TRACE Matrix. As with the CPI, TRACE assigns a score and a rank to each of the 197 countries in the index, but the scoring methodology is reversed such that 1 represents the lowest risk and 100 the highest risk. The Matrix country scores are based on an average of four “domain” scores, which measure corruption based on: (1) business interactions with government, (2) anti-bribery laws and enforcement, (3) government transparency and civil service and (4) capacity for civil society oversight, including media.
How does the TRACE Matrix differ from the CPI?
- Detailed scores and rankings: Where the CPI provides an overall score and ranking for each country, the Matrix provides sub-scores for each of the four risk domains and nine additional sub-domains that constitute the overall average score.
- Business bribery risk: The CPI addresses overall levels of perceived corruption, combining data across a wide range of government functions and social sectors. In contrast, the Matrix focuses specifically on business bribery risk and on the particular factors that are deemed most relevant to companies.
- Data sources: The 2014 CPI uses 13 different data sources and only provides scores and rankings for countries if they are covered by at least three of those sources. The Matrix uses 49 data sources.
- Range of countries assessed: The 2014 CPI assesses 175 countries, whereas the Matrix assesses 198. The CPI covers 28 countries in Asia-Pacific but excludes Brunei and a number of Pacific island territories, while the Matrix covers 34 countries but notably excludes Taiwan, North Korea and Myanmar.
- Frequency of publication: Where the CPI is published annually, the Matrix is due to be published once every two years.
Results for Asia Pacific Countries 2014: A Comparison
- Of the 28 Asia-Pacific countries on the CPI 2014, only 10 scored a passing grade of 50 or more out of 100. The remaining 18 all scored less than 40 out of 100. Despite their different approaches, this is broadly consistent with the Matrix, with 11 of the 34 Asia Pacific countries featured scoring 50 or less out of 100.
- Countries with significant improvements in their CPI rankings include India and the Philippines (both up nine places since 2013), Thailand (up 17 places) and Indonesia (up seven places). Similarly, Sri Lanka has partly reversed its 12-place fall in the CPI ranking last year with a six-place rise this year.
- Thailand in particular is notable for its marked resurgence in the CPI rankings, having dropped 38 places between 2011 and 2013 only to rise 17 places this year to join 85th place alongside a number of countries, including India. However, Thailand has been ranked considerably higher still on the Matrix, in 41st place, scoring comparatively well across all four domains but especially under the “anti-bribery and enforcement” domain. India, on the other hand, has been ranked 100 places lower on the Matrix, in 185th. This low ranking is attributable to India’s particularly poor score for the “interactions with government” domain.
- Countries that have experienced a significant decline in their CPI rankings include China (down 20 places since 2013), Nepal (down 10 places), Timor-Leste (down 14 places) and Bangladesh (down nine places).
- China’s slide in the rankings is particularly interesting, given that the Chinese government has launched an exceptionally aggressive and well-publicized anti-corruption campaign in recent years that shows no signs of tailing off. China’s fall in the rankings may be partly attributable to the fact that increased enforcement has revealed information about the extensive use of corrupt practices, providing more data points for TI’s assessment of corruption.
- Countries whose positions on the CPI remain relatively static, with either no or minimal change in rankings or score, include Hong Kong, Bhutan, South Korea, Malaysia, Mongolia, Vietnam, Laos, Cambodia and Myanmar. Similarly, North Korea and Somalia remain unchanged in the bottom ranking on the CPI.
- South Korea is an interesting case study for comparison between the CPI and the Matrix. Where South Korea sits at 43rd on the CPI, it is ranked much higher on the Matrix, in 17th place (and ranks top for the “anti-bribery and enforcement” domain).
The Matrix has provided the business community with a valuable additional tool for measuring bribery risks that is relevant to developing risk-based compliance solutions. However, it is not the ultimate solution for assessing and responding to business bribery risks, nor is it a replacement for the CPI. Published annually and easily accessible, the CPI continues to provide authoritative, up-to-date information that puts users “on notice” of perceived levels of corruption across the public sector spectrum. The Matrix should therefore be used in conjunction with the CPI, as well as other existing indices in order to develop a full picture of relevant corruption risks in any given country.
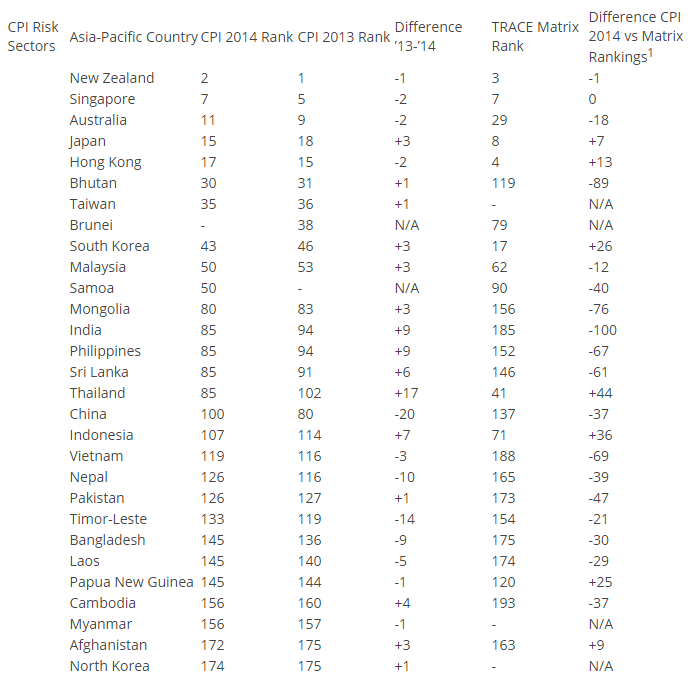
1 The figure in this column takes the CPI score for a country as the marker and reflects how much higher or lower the Matrix ranks that country (i.e. a figure of ‘-1′ for New Zealand demonstrates that New Zealand is ranked one place lower on the Matrix than the CPI; a figure of +7 for Japan demonstrates that Japan is ranked seven places higher on the Matrix than the CPI).
Source: Corporate Compliance Insights – Asia Pacific Anti-Corruption Rankings for 2014