


Elliott Wave Analysis On USD Index And S&P500

 USD Index
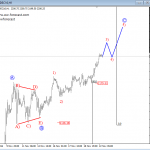
USD index is trading at new highs, so we are wondering if latest development is going to be one-two, one-two bullish scenario. Notice that leg up from 95.81 is quite sharp so wave three can be considered up to around 99.00 area but after a completed black subwave 2 pullback that can be in the cards for the next few sessions to hit 95.50-96.00 region before uptrend resumes. At the moment we see price at our possible reversal zones, which means we could be facing some higher prices in seasons ahead.
USD Index, 4H

Click to Enlarge
S&P500
S&P500 is trading nicely higher this month, with a clear impulsive personality away from 1981 area where market completed a big corrective set-back. As such, we will look now much higher on stocks as current rally should be made by five waves. At the moment, we see market trading very slow in the middle of a summer, so we believe it’s just a pause within uptrend. We are looking at wave four now that can be a triangle which should send price to a new high; up into wave 5), possibly even to 2200 region.
S&P500, 4H

Click to Enlarge
http://www.ew-forecast.com/service
Find more: Contributing Authors
Related Posts
 Elliott Wave Analysis On EURUSD And S&P500
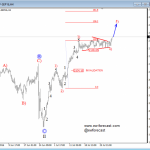 Elliott Wave Analysis: S&P500 Aiming High, As Bulls Push Price Higher
 Elliott Wave Analysis: S&P500 Nicely Trading Higher Within An Ending Diagonal
 Elliott Wave Analysis: S&P500 Reaching For More Upside, 2170/2190 Zone Is In View
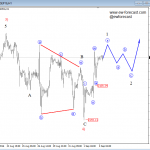 Elliott Wave Analysis On Crude OIL And S&P500


