Elliott Wave Analysis: Triangle On USDMXN Points Lower

Elliott Wave Analysis: Triangle On USDMXN Points Lower
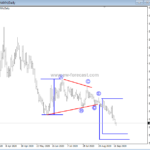
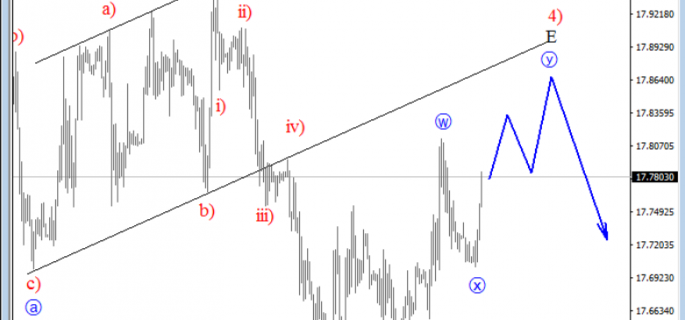
On the 4h chart of USDMXN, we see price going complex, displying a slow and overlapping price activity, which is why a triangle pattern can be in progress. We know that triangle corrections always unfold slowly and when they do, they consist out of five legs. In our case, we see four of the waves already finsihed, which means only one more leg needs to unfold, before a new drop lower may come in play. Another note for a triangle correction, is that it occures prior to the final wave, which means once this correction in wave 4) unfolds a new drop lower into final wave 5) may be expected.
USDMXN, 4H

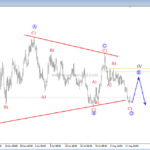
Let’s skip to the intra-day chart of USDMXN. Here we have a closer look at the final leg E of this triangle correction. We can see that maybe corretive leg E will unfold as a complex w-x-y correction and search for a possible top and resistance near the upper channel line. There, we think a new reversal lower may come in play and start a new impulsive sequence into bigger wave five.
USDMXN, 1H

Disclosure: Please be informed that information we provide is NOT trading recommendation or investment advice. All of our work is for educational purposes only.
http://www.ew-forecast.com/service
Find more: Contributing Authors