Elliott wave Analysis: USDMXN Aiming For 20.000

Elliott wave Analysis: USDMXN Aiming For 20.000
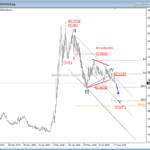
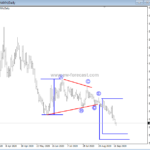
On the daily chart of USDMXN we can see that price may be trading in a bigger, three-wave recovery as part of a bigger corrective retracement. We labelled this retracement as wave B), which can see limited upside and a bearish turn around the 20.20/20.60 region. Also, at the mentioned region we see the upper channel line and the Fibonacci ratios of 100.0 and 161.8, where both can act as turning points lower.
USDMXN, Daily

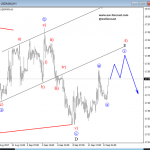
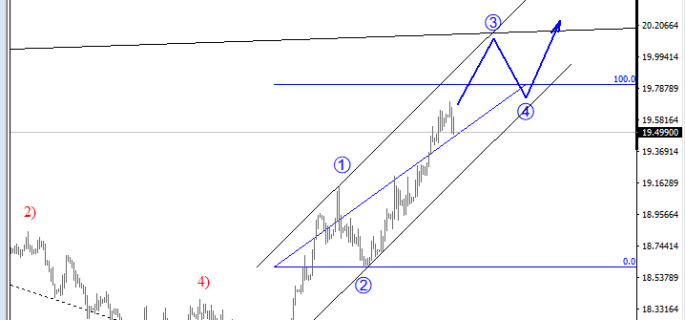
Now, switching to the 4h chart, where we have a better look at an unfolding impulsive sub-wave C of B). Wave C is an impulse, which means it must contain five legs for it to be valid. We currently see leg 3 of C in progress, which is known as the strongest and steepest wave, and can in this instance extend its rise towards the 20.20 region. There some slow price activity may follow, as we believe a temporary pullback may start to show up, labelled as wave 4.
USDMXN, 4h

Disclosure: Please be informed that information we provide is NOT trading recommendation or investment advice. All of our work is for educational purposes only.
http://www.ew-forecast.com/service
Find more: Contributing Authors