


Annual inflation up to 2.1% in the euro area
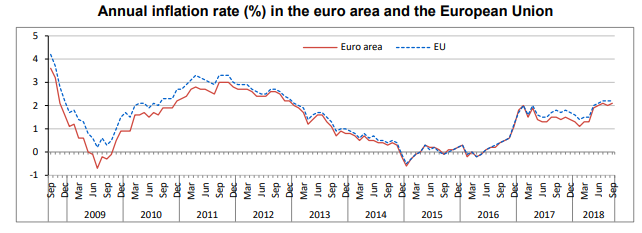
The Euro area annual inflation rate was 2.1% in September 2018, up from 2.0% in August. A year earlier, the rate was 1.5%. European Union annual inflation was 2.2% in September 2018, stable compared to August. A year earlier, the rate was 1.8%. These figures are published by Eurostat, the statistical office of the European Union.
The lowest annual rates were registered in Denmark (0.5%), Greece (1.1%) and Ireland (1.2%). The highest annual rates were recorded in Romania (4.7%), Hungary (3.7%) and Bulgaria (3.6%). Compared with August 2018, annual inflation fell in nine Member States, remained stable in four and rose in fourteen.
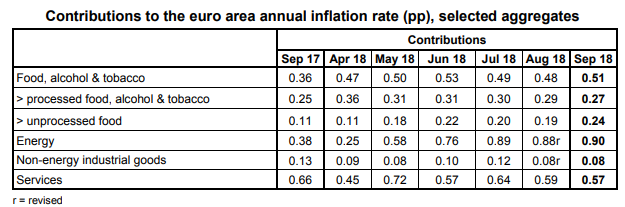
In September 2018, the highest contribution to the annual euro area inflation rate came from energy (+0.90 percentage points, pp), followed by services (+0.57 pp), food, alcohol & tobacco (+0.51 pp) and non-energy industrial goods (+0.08 pp).

The full dataset is available in the Eurostat online database.
Geographical coverage
The euro area consists of Belgium, Germany, Estonia, Ireland, Greece, Spain, France, Italy, Cyprus, Latvia, Lithuania, Luxembourg, Malta, the Netherlands, Austria, Portugal, Slovenia, Slovakia and Finland.
The European Union includes Belgium, Bulgaria, the Czech Republic, Denmark, Germany, Estonia, Ireland, Greece, Spain, France, Croatia, Italy, Cyprus, Latvia, Lithuania, Luxembourg, Hungary, Malta, the Netherlands, Austria, Poland, Portugal, Romania, Slovenia, Slovakia, Finland, Sweden and the United Kingdom.
The euro area and European Union data refer to the respective country compositions at a specific point in time. New Member States are integrated into the aggregates using a chain index formula.
Data for the United Kingdom for September 2018 were not available in time for publication. Due to this fact, the EU totals have been calculated using Eurostat estimates.
Methods and definitions
The annual rate measures the change of the Harmonised Indices of Consumer Prices (HICP) between a month and the same month of the previous year, and the monthly rate compares the indices between the two latest months.
A contribution shows how much of the annual inflation rate comes from a particular component of the HICP. The contributions are calculated according to a method which ensures their additivity (allowing for rounding).
Revisions and timetable
A flash estimate of euro area inflation is issued at the end of each reference month. The euro area flash estimate for September 2018, published on 28 September 2018, was 2.1%. The next flash estimate of euro area inflation with data for October 2018 is scheduled for 31 October 2018.
Source: Eurostat
Related Posts
 Annual inflation up to 0.4% in the euro area; The highest and lowest annual rates
 Annual inflation stable at -0.3% in the euro area
 Hourly labour costs ranged from €4.9 to €42.5 across the EU Member States in 2017
- Euro area annual inflation up to 0.4%
 Business investment rate up to 23.3% in the euro area


