AUDUSD Expects to See More Upside Activity – Elliott wave analysis

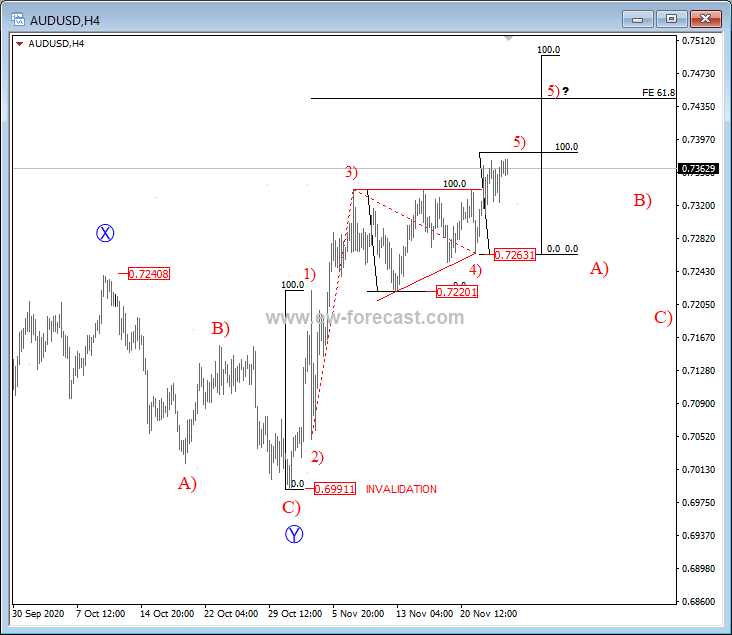
On the 4h chart of AUDUSD we can see market trading in a bullish price move, commonly named an impulse. An impulse is a five-wave move, that trades into the direction of the stronger trend (in our case to the upside). That said, we know that nothing moves in straight lines, which means that after an 1-2-3-4-5 move develops, a temporary A-B-C correction follows.
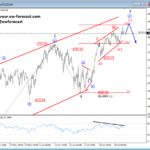
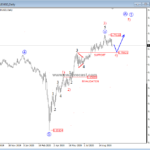
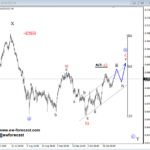
On our chart we see price now trading out of a triangle correction, which was located in wave 4), and into a wave 5), that can target 0.738 possible resistance area, or higher resistance at the 0.744 level. That said, once wave 5) unfolds, and we see price in a new impulsive and strong drop, also below the 0.726 level, that is when an A)-B)-C) correction can be underway, and bulls temporary on hold.
AUDUSD, 4h
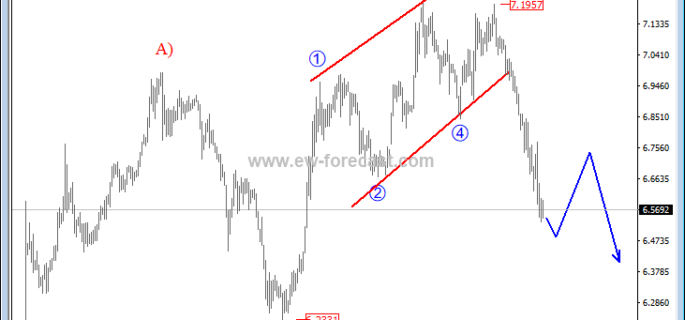
Now let us look at USDCNH, market, which is negatively correlated to the AUDUSD.
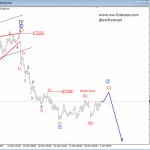
USDCNH completed a big A)-B)-C) correction in 2020, and started declining impulsively, down from 7.19 high. This impulsive fall suggests more upside on the AUDUSD on the long-term, however on the near-term we still need to be aware of temporary pullbacks, as expected on AUDUSD 4h chart.
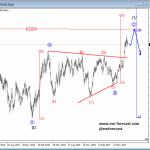
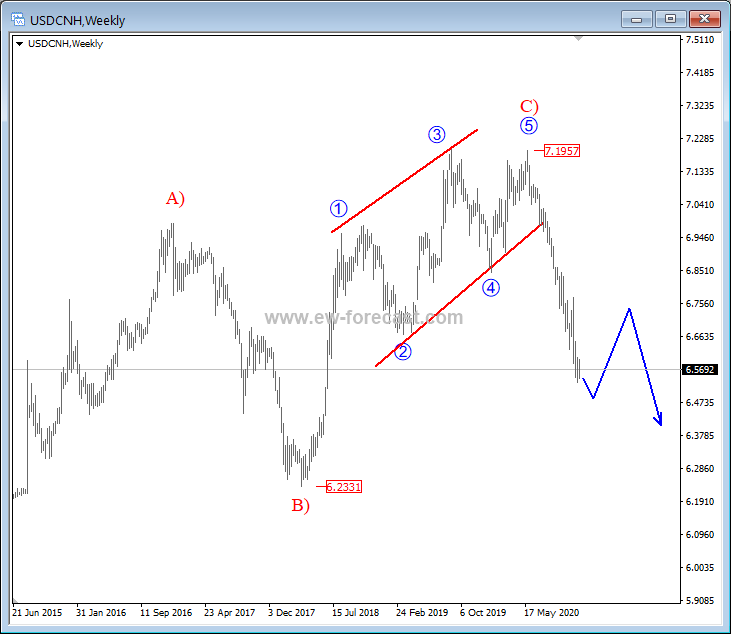
USDCNH, weekly
Disclosure: Please be informed that information we provide is NOT trading recommendation or investment advice. All of our work is for educational purposes only.
http://www.ew-forecast.com/service
Find more: Contributing Author