IS USD Index Going Up or Down?

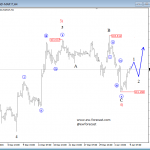
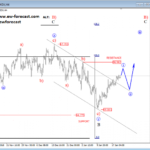
On the daily chart of USD Index we see price looking bearish. We can see that price since January 2017 unfolded and completed three bearish waves. Well we know that an impulse must contain five-wave for a completed pattern, which gives us thinking that maybe more weakness may follow on the usd index. However, recent price activity looks bullish, away from September lows, which can be a wave 4) correction in the making or if price suddenly breaches above the trendline resistance a new minimal three wave reversal to the upside. A decisive breach would confirm a change in trend from bearish to bullish and more gains may start to follow.
USD Index, Daily

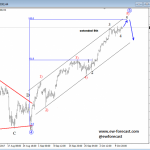
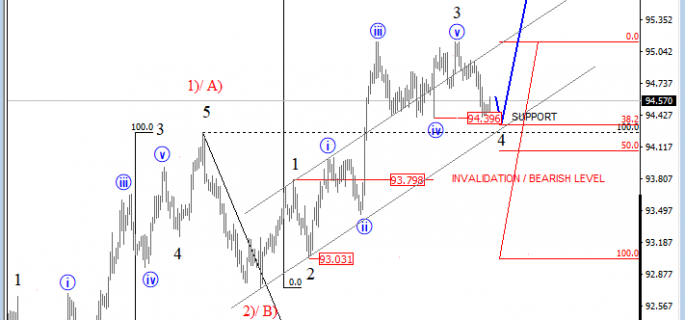
Now switching to the 4h view, where we have a better look at the current three-wave rise from September low. Currently we see price unfolding a five-wave impulse within wave 3) or C), that can target region near the 161.8. Fibonacci ratio. However, currently price is making a temporary pullback wihin minor wave 4, that can search for support near the Fibonacci ratio of 38.2 and 50.0 and later make a new bounce higher.
USD Index, 4H

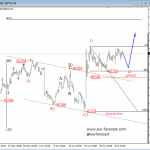
Looking overall, if price breaches above the 96.00 region that a change in trend can be in play and more gains may follow, but if price breakes lower, then bearish run since January of 2017 is stil incomplete.
Disclosure: Please be informed that information we provide is NOT trading recommendation or investment advice. All of our work is for educational purposes only.
http://www.ew-forecast.com/service
Find more: Contributing Authors